Development and Contributing
Requirements
TeslaMate officially supports the versions listed below. However, TeslaMate aims to maintain compatibility with the last three major releases of Erlang and Postgres, as well as the last three minor releases of Elixir. When contributing, please use the versions listed below, which match those used in official TeslaMate distributions.
- Elixir >= 1.19.5-otp-26
- Postgres >= 18.0
- Grafana = 12.4.0
- An MQTT broker e.g. mosquitto (optional)
- NodeJS >= 22.22.0
or Nix. You can then use the nix devenv (via direnv) setup.
Initial Setup
To run the TeslaMate test suite you need a database named teslamate_test:
# download dependencies, create the dev database and run migrations
mix setup

# create the test database
MIX_ENV=test mix ecto.setup
Running locally
Start an iex session in another terminal window:
iex -S mix phx.server
Then sign in with a Tesla account.
Hot reloading
To immediately apply your local changes open or reload http://localhost:4000. You can also reload specific modules via iex, for example:
iex> r TeslaMate.Vehicles.Vehicle
To only compile the changes:
mix compile
Code formatting
Format all files
Install Treefmt or use nix develop or the nix devenv (via direnv) setup.
treefmt
or with nix, when not using direnv:
nix develop --override-input devenv-root "file+file://"<(printf %s "$PWD") . --command treefmt
You can even use a VS Code extension like treefmt to format the files on save.
Only format elixir files
mix format
Update pot files (extract messages for translation)
mix gettext.extract --merge
Testing
To ensure a commit passes CI you should run mix ci locally, which executes the following commands:
- Check formatting (
mix format --check-formatted) - Run all tests (
mix test)
Testing with our CI which builds the Docker images automatically per PR
Our CI automatically builds the Docker images for each PR (only for repo own PRs, not for external PRs). To test the changes introduce by a PR you can edit your docker-compose.yml file as follows (replace pr-3836 with the PR number):
For TeslaMate:
teslamate:
  # image: teslamate/teslamate:latest
  image: ghcr.io/teslamate-org/teslamate:pr-3836
For Grafana:
grafana:
  # image: teslamate/grafana:latest
  image: ghcr.io/teslamate-org/teslamate/grafana:pr-3836
Making Changes to Grafana Dashboards
To update dashboards you need Grafana running locally. The following docker-compose.yml can be used for this purpose:
services:
  grafana:
    image: teslamate/grafana:latest
    environment:
      - DATABASE_USER=postgres
      - DATABASE_PASS=postgres
      - DATABASE_NAME=teslamate_dev
      - DATABASE_HOST=host.docker.internal
    ports:
      - 3000:3000
    volumes:
      - grafana-data:/var/lib/grafana

volumes:
  grafana-data:
(on Linux use the actual IP address of the host as DATABASE_HOSTinstead of host.docker.internal)
Then build the image with make grafana and run the container via docker compose up grafana.
Access the Grafana at http://localhost:3000 and sign in with the default user admin and password admin.
Then edit the respective dashboard(s) locally. To export a dashboard hit the 'Save' button and select Save JSON to file. The final JSON file belongs in the directory ./grafana/dashboards/. To apply the changes rebuild the image and start the container.
When making larger changes to Grafana Dashboards please include updated screenshots (1920x1080 @ x2, Grafana running in Kiosk mode) in ./website/static/screenshots. Ensure to blur sensitive information.
Best Practices
Queries involving timestamp columns
Datetime values are currently stored in columns of type timestamp. This is NOT recommended.
While Grafana macros like $__timeFilter & $__timeGroup are working PostgreSQL functions like DATE_TRUNC() require additional treatment.
Grafana is not setting the PostgreSQL session timezone. To ensure truncation is done with respect to the Grafana timezone setting, set the optional time_zone argument for DATE_TRUNC().
DATE_TRUNC('day', TIMEZONE('UTC', date), '$__timezone')
In addition, ensure to compare either values with or without time zone.
Streaming API data / positions table usage in dashboard queries
When Streaming API is enabled roughly 1 GB of data is gathered per car and 30 000 km. Most of that data (95+ percent) is stored in positions table. For optimal dashboard performance these recommendations should be followed:
- only query positions table when really needed
- if data in 15 second intervals is sufficient consider excluding streaming data by adding
ideal_battery_range_km IS NOT NULL and car_id = $car_idas WHERE conditions
Before opening pull requests please diagnose index usage & query performance by making use of EXPLAIN ANALYZE.
Enable pg_stat_statements to collect query statistics
To quickly identify performance bottlenecks we encourage all contributors to enable the pg_stat_statements extension in their instance. For docker based installs you can follow these steps:
-
Enable the pg_stat_statements module
services:database:image: postgres:18-trixie...command: postgres -c shared_preload_libraries=pg_stat_statements... -
Create Extension to enable
pg_stat_statementsviewCREATE EXTENSION IF NOT EXISTS pg_stat_statements; -
Identify potentially slow queries (mean_exec_time)
SELECT query, calls, mean_exec_time, total_exec_time FROM pg_stat_statements ORDER BY mean_exec_time DESC LIMIT 10; -
Identify frequently executed queries (calls)
SELECT query, calls, mean_exec_time, total_exec_time FROM pg_stat_statements ORDER BY calls DESC LIMIT 10;
Additional details about pg_stat_statements can be found in the PostgreSQL docs
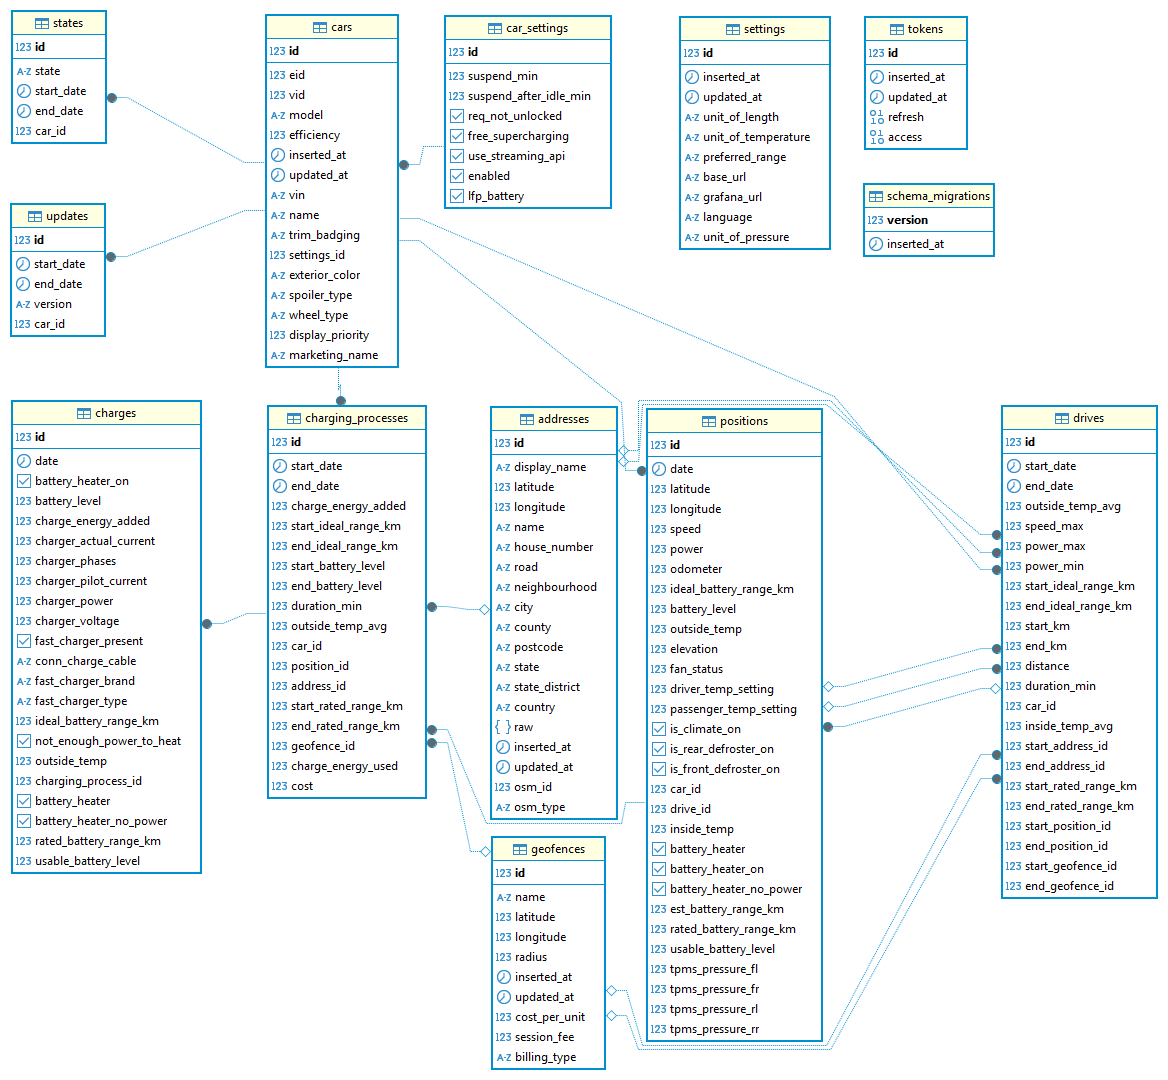
Entity Relationship Model (ERM)
Contributing to TeslaMate
We welcome contributions! To keep the project sustainable and legally protected, we have two main requirements for all Pull Requests:
1. License (AGPLv3)
By contributing to TeslaMate, you agree that your contributions will be licensed under the GNU Affero General Public License v3 (AGPLv3). This ensures that the software remains free and open, even when offered as a service over a network.
2. Contributor License Agreement (CLA)
Before we can merge your first Pull Request, you must sign our Fiduciary License Agreement (FLA 2.0).
- Why? This gives the
teslamate-orgthe legal standing to protect the project (e.g., against trademark misuse or license violations) and guarantees that the project will always remain Free Software. - How? When you open a PR, our
@cla-assistantbot will post a comment with a link to sign the agreement using your GitHub account. It only takes a few seconds. - More Info: You can find the full text and further details in our Legal Repository.
Pre-Merge Checks for Dependency Updates
When reviewing a pull request that updates dependencies, it's crucial to verify that the changes are correct and don't break the Nix-based development environment. After checking out the branch of the PR, run the following commands:
nix flake check ...: Verifies the flake's integrity across different systems.nix build ...: Ensures the project builds successfully with the new dependencies.nix develop ... --command treefmt: Checks if the code formatting still runs.devenv up: Confirms that the development environment starts up as expected.
# Run these commands to ensure everything works as expected
nix flake check --override-input devenv-root "file+file://"<(printf %s "$PWD") . --all-systems
nix build --override-input devenv-root "file+file://"<(printf %s "$PWD")
nix develop --override-input devenv-root "file+file://"<(printf %s "$PWD") . --command treefmt
devenv up
It is most likely you need to change the hash in ./nix/flake-modules/package.nix. This could be mixFodDeps, npmDepsHash, or the sha256 for cldr.
A cldr version update is particularly critical. The old hashes will still appear to work if you previously built using the old hash. But will silently get the old file not the new file.